Catching Fraud in Real Time — and Explaining Why
A full-stack fraud detection system that monitors financial transactions as they happen, flags suspicious activity using machine learning, and shows exactly which signals triggered each alert — so humans can trust the decision.
ROLE
ML Engineer
TYPE
ML Detection System + Dashboard
STACK
Python · XGBoost · FastAPI · SHAP
CODE
THE PROBLEM
Fraudulent transactions happen in milliseconds — and most systems can't explain why they flagged one
Financial fraud costs billions every year. Transactions happen fast — a purchase, a transfer, a withdrawal — and the window to catch a fraudulent one is tiny. Automated systems need to make split-second decisions about which transactions look suspicious and which are legitimate.
But catching fraud is only half the problem. When a system flags a transaction, someone needs to understand why. A black-box model that says “fraud” with no explanation creates a different kind of risk — false positives that block real customers, and no way to know if the system is actually learning the right patterns.
Speed Matters
Fraudulent transactions happen in real time. Detection systems need to keep up — flagging suspicious activity before money disappears.
Black-Box Decisions
Most ML models say “fraud” or “safe” without explaining why. That makes them hard to trust, debug, or improve.
Costly False Positives
Blocking a legitimate transaction frustrates real customers. The system needs to balance catching fraud without crying wolf.
THE SOLUTION
A fraud detection system that catches suspicious transactions and explains its reasoning
I built an end-to-end fraud detection pipeline — from data simulation and feature engineering through model training to a live dashboard. The system classifies each transaction as Fraud or Safe, then shows the specific factors that drove each decision, making the ML model transparent and auditable.
01
Real-Time Detection
Simulated transactions are classified on the fly — each one scored for fraud risk using a trained machine learning model, with results displayed instantly on a live dashboard.
02
Explainable Decisions
Every prediction comes with a SHAP explanation showing exactly which factors — spending patterns, anomaly scores, transaction size — pushed the decision toward “Fraud” or “Safe.”
03
Smart Feature Engineering
The model doesn’t just look at raw transaction data. It uses engineered signals like rolling spending averages, time-of-day patterns, and anomaly detection scores to spot suspicious behavior.
04
Tuned Thresholds
The fraud/safe boundary was systematically tested across multiple thresholds to balance catching real fraud against blocking legitimate customers.
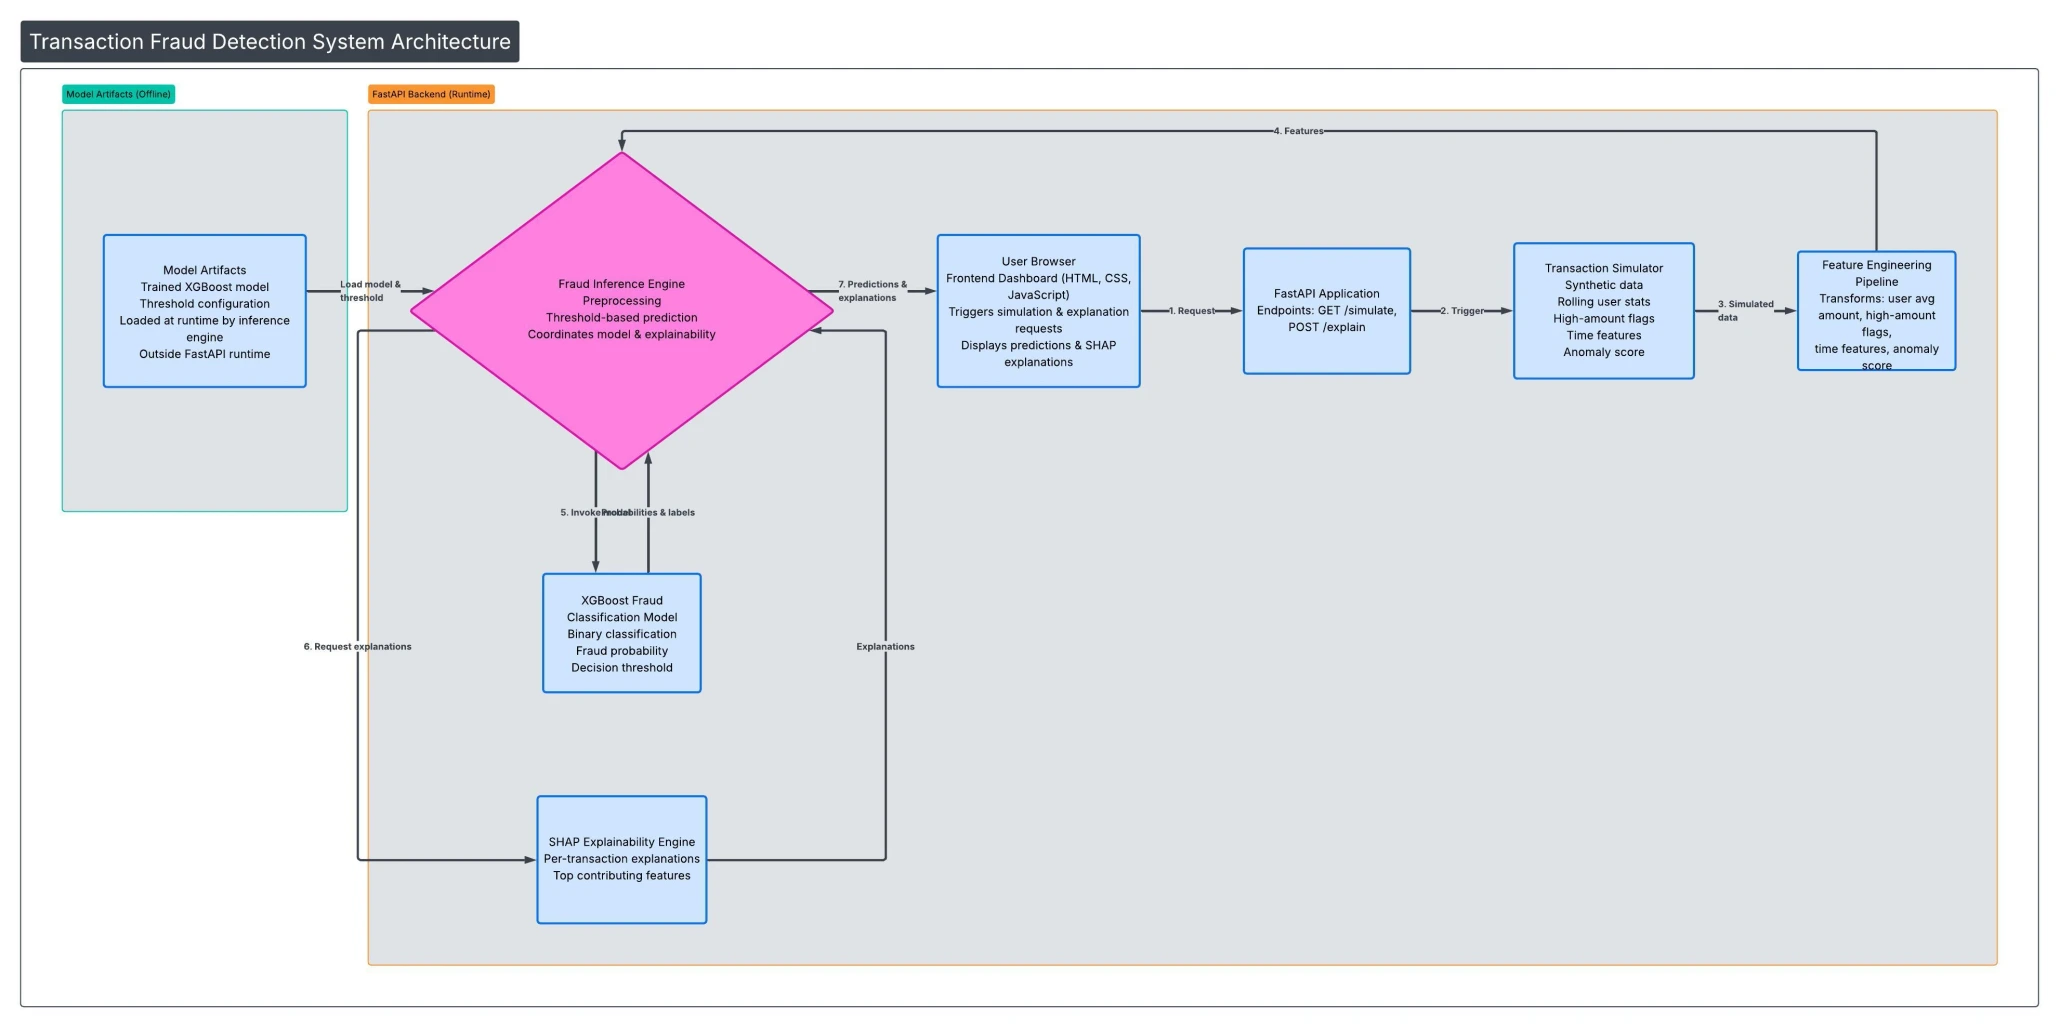
HOW IT WORKS
Five stages from raw transaction to explained verdict
Each transaction flows through a pipeline: simulated data gets enriched with behavioral signals, the model scores fraud risk, and the decision is explained — all in one pass, displayed on a real-time dashboard.
SEE IT IN ACTION
From transaction data to fraud verdict — with receipts
The dashboard shows every transaction in real time, flagging suspicious ones and letting users click “Explain” on any prediction to see exactly what drove the decision.
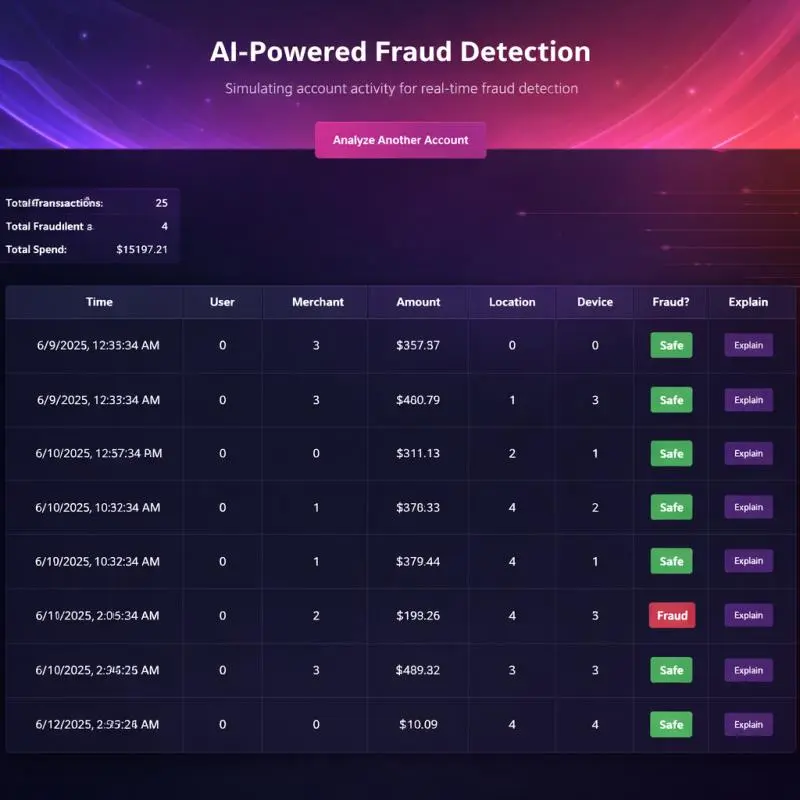
Live Transaction Dashboard
Real-time view of all transactions with fraud classifications, transaction amounts, and summary statistics — total transactions, fraud count, and total spend at a glance.
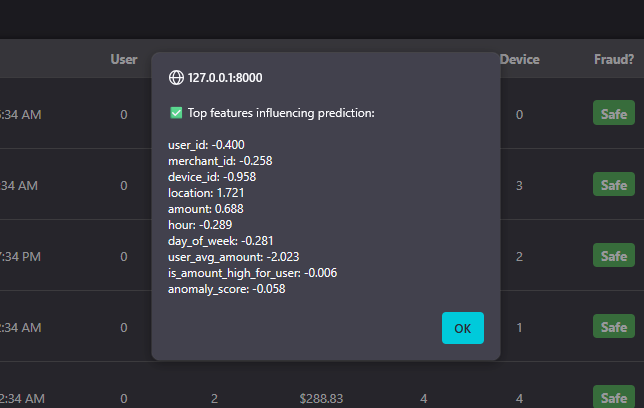
SHAP Explainability Popup
Click “Explain” on any transaction to see which features drove the prediction. Positive values push toward “Fraud,” negative values push toward “Safe” — full transparency for every decision.
ENGINEERING DECISIONS
Why I built it this way
Two-layer detection: anomaly scoring + classification
Rather than relying on a single model, the system combines unsupervised anomaly detection (Isolation Forest) with supervised classification (XGBoost). The anomaly score becomes a feature itself — giving the classifier a "suspiciousness" signal that captures patterns no single engineered feature could.
Explainability as a first-class feature, not an afterthought
SHAP explanations aren't hidden in a notebook — they're surfaced directly in the dashboard UI. This mirrors how real fraud teams work: analysts need to understand why a transaction was flagged before they can act on it.
Systematic threshold tuning over default cutoffs
Instead of accepting the default 0.5 classification threshold, I tested a range from 0.3 to 0.7 and evaluated the precision/recall tradeoff at each point. The final threshold was chosen to balance catching real fraud against false positives — a business decision as much as a technical one.
Full-stack to prove the complete pipeline
This isn't a Jupyter notebook. It's a working API serving real-time predictions to a frontend — proving the model can operate in a production-like environment, not just in isolation.
BY THE NUMBERS
Impact at a glance
87%
Overall accuracy classifying transactions as fraud or safe
5
Pipeline stages from data simulation to explained prediction
100%
Prediction explainability — every decision shows its reasoning
TECH STACK
Built with
REFLECTIONS
What I learned building this
Feature engineering matters more than model complexity
The biggest performance gains didn’t come from hyperparameter tuning — they came from engineering better features. Rolling averages, time patterns, and anomaly scores gave the model signals it couldn’t learn from raw data alone.
Threshold selection is a business decision
Choosing the fraud cutoff isn’t a purely technical exercise. A lower threshold catches more fraud but blocks more legitimate customers. The “right” answer depends on what the business can tolerate.
Explainability builds trust — and catches bugs
Adding SHAP explanations didn’t just make the system more transparent for users. It helped me catch cases where the model was relying on features that shouldn’t matter — something accuracy metrics alone wouldn’t reveal.
End-to-end beats isolated notebooks
Deploying the model behind a real API and connecting it to a dashboard forced me to solve problems — latency, data formatting, error handling — that never come up in a Jupyter notebook.
EXPLORE
Want to see the code?
The full source code, architecture documentation, and sample reports are available on GitHub.