Teaching a Robot to Navigate — and Showing You How It Thinks
An intelligent pathfinding system that navigates a robot through obstacles using classical AI search algorithms — with real-time 3D visualization that lets you watch the algorithm explore, decide, and move step by step.
ROLE
Robotics Engineer
TYPE
AI Search & 3D Simulation
STACK
Python · PyVista · A* · NumPy
CODE
THE PROBLEM
Robots need to find their way through complex environments — and engineers need to see how
Autonomous navigation is one of the foundational problems in robotics and AI. A robot sitting in a room full of obstacles needs to figure out the best path from where it is to where it needs to go — quickly, reliably, and optimally. Different algorithms approach this problem in very different ways, and choosing the right one depends on what you’re optimizing for.
But here’s what’s missing from most implementations: you can’t see the algorithm work. The search is invisible — it runs in milliseconds and spits out a path. That makes it hard to understand tradeoffs, debug issues, or build intuition about why one approach outperforms another.
Finding the Best Path
A robot must navigate around obstacles to reach its goal. Some paths are shorter but riskier, others are safer but longer — the algorithm decides.
Invisible Decision-Making
Most pathfinding demos show you the final path but hide the search process. You can’t see what the algorithm explored, rejected, or prioritized.
Tradeoffs Are Hard to Grasp
A* is “optimal” and Greedy is “fast” — but what does that mean in practice? Without visualization, the differences stay theoretical.
THE SOLUTION
A navigation system that lets you watch the AI think in real time
I built a modular pathfinding system with three search algorithms and a real-time 3D visualization that shows every step of the process — which nodes the algorithm explores, which it puts on the frontier, and the final path it computes. You can switch algorithms, change the environment, and watch how each one approaches the same problem differently.
01
Multiple Search Algorithms
A*, Dijkstra, and Greedy Best-First Search — each with distinct tradeoffs between speed, optimality, and completeness. Swap between them instantly.
02
Real-Time 3D Visualization
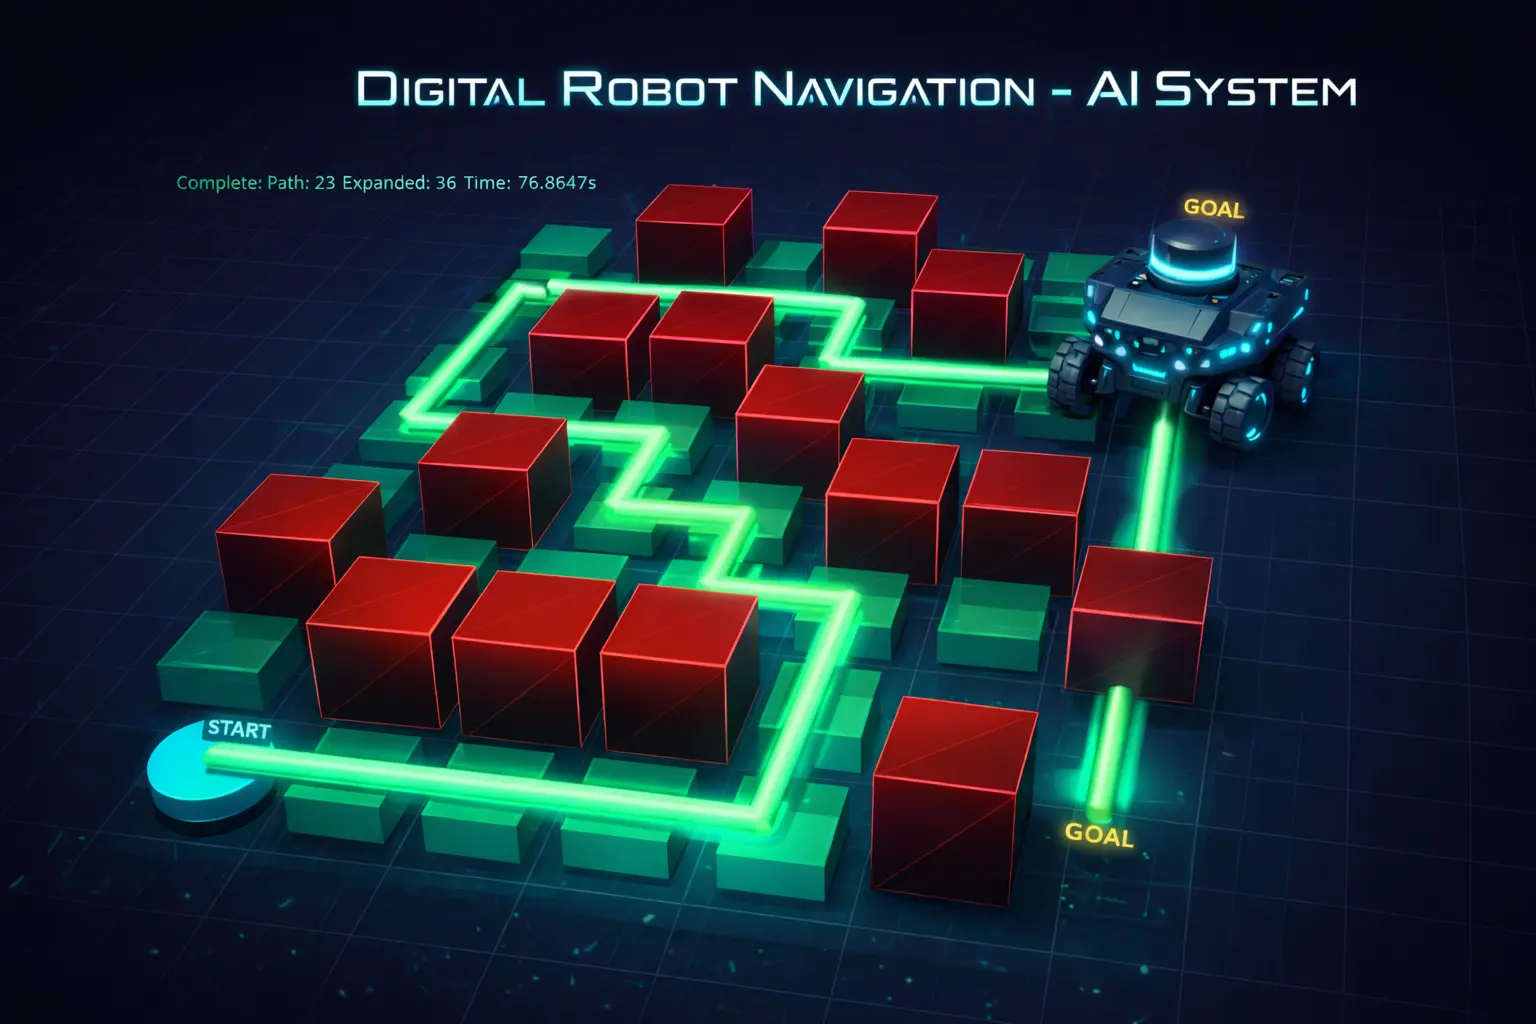
Watch the algorithm explore the grid live in an interactive 3D environment — explored nodes glow green, frontier nodes glow orange, and the final path lights up cyan.
03
Animated Robot Movement
A 3D robot model moves smoothly along the computed path with follow-camera support, making the abstract output tangible and intuitive.
04
Performance Metrics
Every run tracks nodes expanded, path length, and runtime — so you can quantitatively compare how each algorithm performs on the same map.
HOW IT WORKS
Configure, plan, visualize, compare
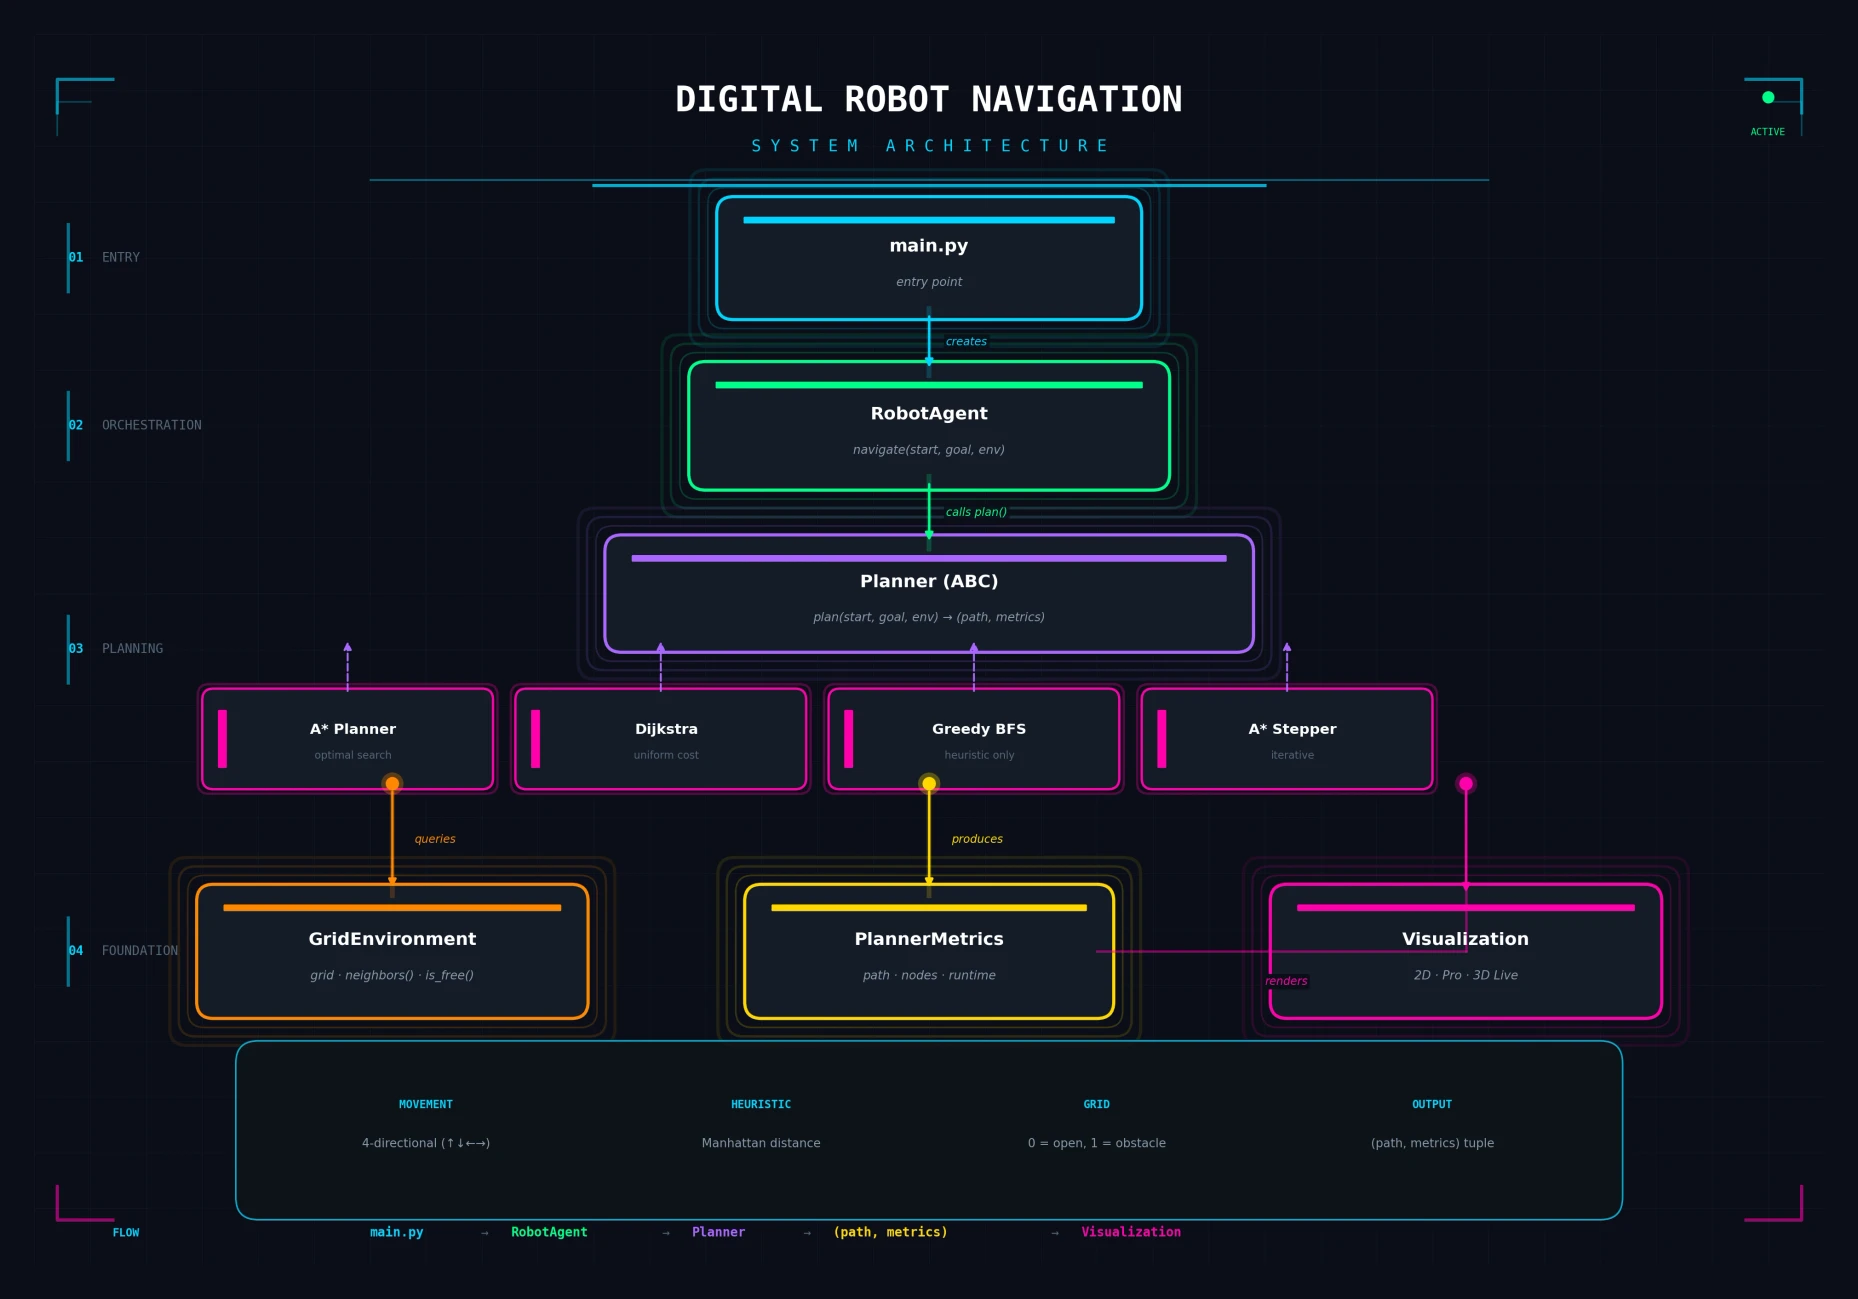
The system follows a clean pipeline: you define the environment (a grid with obstacles), choose an algorithm and visualization mode, and the system plans the path, renders it in real time, and reports performance metrics.
SEE IT IN ACTION
Configure, run, and watch the robot navigate in 3D
The system offers multiple visualization modes — from minimal 2D plots for quick debugging to a fully interactive 3D environment where you can watch the search algorithm explore the grid, see the robot move along the computed path, and rotate the camera freely around the scene.
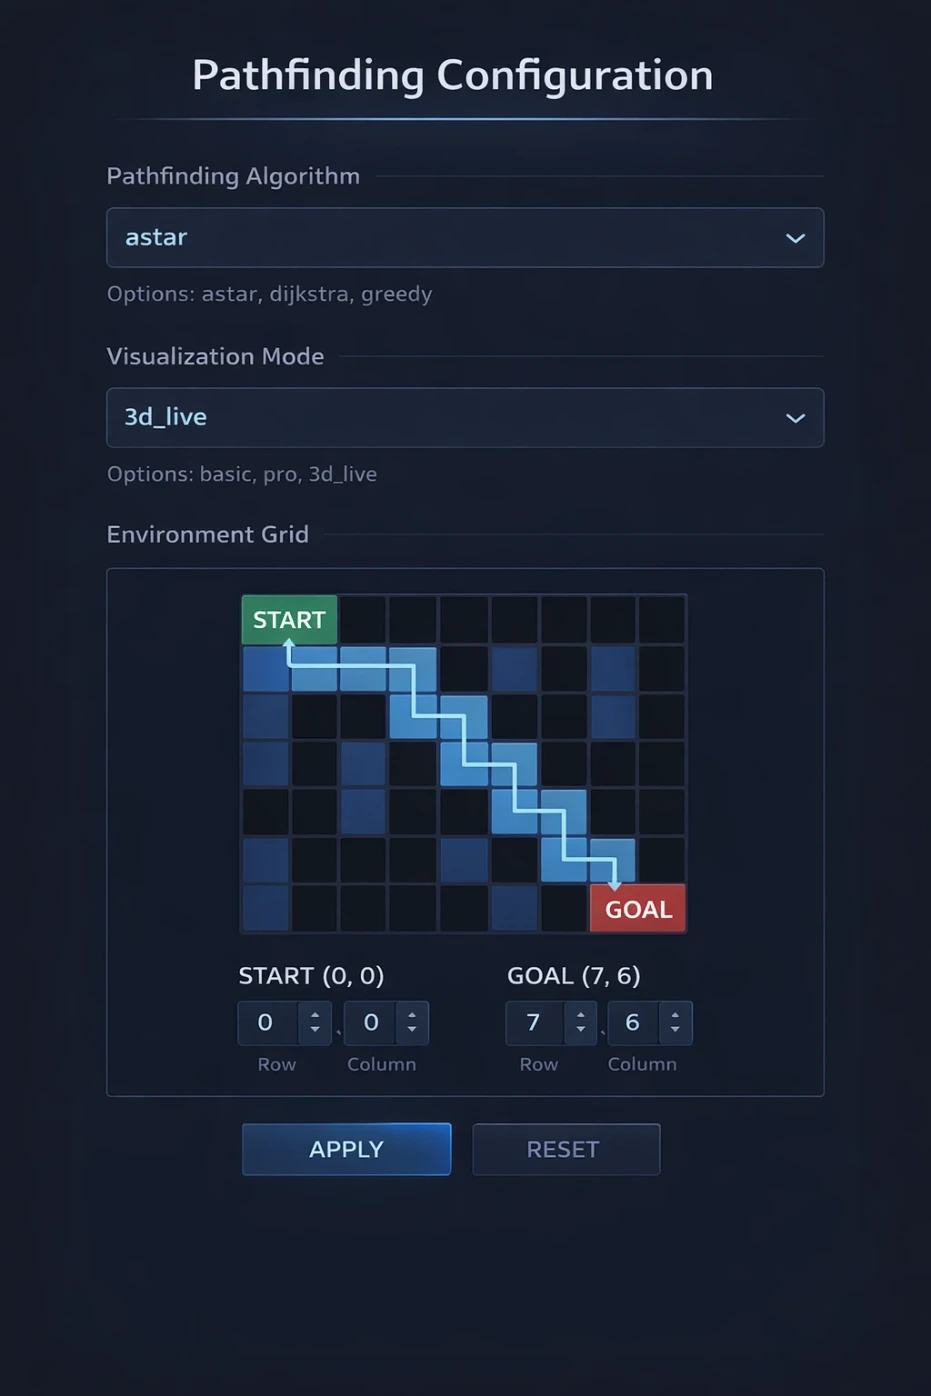
Configuration Options
Choose your pathfinding algorithm, visualization mode, grid layout, and start/goal positions. The modular design makes switching between setups instant — compare A* vs. Greedy on the same map with one line change.

3D Live Visualization
Watch the search unfold in real time — explored nodes glow green, the frontier glows orange, and the final path lights up cyan. Rotate, zoom, and pan the interactive 3D environment freely.
ENGINEERING DECISIONS
Why I built it this way
Strategy pattern for swappable algorithms
All planners implement the same abstract interface. This means the RobotAgent, visualization, and metrics systems work identically regardless of which algorithm is running — and adding a new one is a single class with two methods.
A* Stepper for live visualization
Standard A* returns a complete path. I built a custom "Stepper" variant that yields intermediate search events (expand, frontier, path) at each iteration — making it possible to visualize the algorithm in real time without modifying the core search logic.
Layered architecture over monolithic script
Separating environment, planning, orchestration, and visualization into distinct modules means each can be tested, extended, and replaced independently. This isn't a demo script — it's designed like production software.
PyVista for interactive 3D over static renders
Static images of pathfinding are everywhere. Interactive 3D with camera controls, animated robot movement, and real-time search progression makes the abstract concepts tangible — and far more engaging for a portfolio audience.
BY THE NUMBERS
Impact at a glance
3
Search algorithms with a unified, swappable interface
3
Visualization modes — Basic 2D, Professional 2D, and Interactive 3D
<0.01s
Typical A* search runtime on demo environments
TECH STACK
Built with
REFLECTIONS
What I learned building this
Visualization is understanding
Watching A* explore vs. Dijkstra explore on the same map taught me more about their tradeoffs than any textbook description. Building the visualization wasn’t just a feature — it was how I deepened my own understanding of these algorithms.
Clean interfaces make everything easier
The abstract Planner base class meant that adding Greedy BFS took 20 minutes — the visualization, metrics, and orchestration layers already worked. Interface design pays for itself many times over.
Real-time visualization requires different architecture
Standard algorithms return complete results. Making A* yield intermediate steps for live rendering required rethinking the algorithm’s structure — not just wrapping it in a display loop. The Stepper pattern solved this cleanly.
3D adds engagement, but 2D is still essential
The 3D visualization is the showpiece, but the fast 2D modes turned out to be indispensable for debugging and rapid iteration during development. Both serve different audiences and workflows.
EXPLORE
Want to see the code?
The full source code, architecture documentation, and sample reports are available on GitHub.